The same finite observable recurs across several constructions. The native data and conditional controls show where that recurrence is strong and where it stops supporting broader claims.
10. Cross-domain spectral evidence
The cross-domain investigation [23] measures finite ordered-ratio profiles in hydrogen, Kerr and image-derived spectra. Let be the native incidence vector in Corollary 9.2, with centers in the fixed order
Here , and is the first positive zero of the Bessel function . The three relative tolerances are . The native primary abundance statistics are Kerr SUM, H30 UNION and images UNION; the full slot vectors are also compared at each declared tolerance. All ordered nonself pairs and all multiplicities are retained. The fifteen dependent slots are comparison coordinates, not fifteen independent physical observations. The fine-structure constant is not a member of this library.
10.1 Operators and native readouts
Hydrogen coupling graph.
H30 has vertices , , : 465 states and 8,990 undirected edges. For ,
Here are the normalized hydrogen bound-state radial functions in atomic units (). Same-principal-shell edges remain. No magnetic-state expansion or angular factor is inserted. The 464 positive modes have primary readout
with raw modes secondary. The exposure is . H30 is a coupling-graph Laplacian, not the hydrogen energy Hamiltonian. The historical H12 construction has different weights, angular treatment and support; it contributes no substituted values here.
Gravitational Kerr readout.
The development set contains 540 labelled modes with spin weight , , all , overtones , and spins . The rate and readout are
Eligibility is the open cutoff , giving 272,049 development pairs. The 684-mode angular holdout uses with the other selections retained. Modes and zero-spin degeneracies are not independent black-hole observations. A diagonal rate carrier is a declared positive summary; it is not the full nonselfadjoint QNM evolution operator [5, 25].
Image graphs.
Threshold-component centroids define points . The actual complete Gaussian graph is
with and positive eigenvalues divided by their mean. This normalization cancels from ratios. The extraction uses EXIF orientation, a longest side at most 512 pixels, no upsampling, stored-sRGB luminance weights , strict dark thresholds , eight-connected components of inclusive area 4–2,500 pixels and a two-pixel retained-centroid separation rule. There is no crop, feature truncation or post-score contrast adjustment. Bright variants are secondary dependent views. The six primary families are embryo, galaxy, pollen-like microscopy, leaf, Shroud and snowflake; the adult portrait is exploratory. The supplement specifies extraction order, numerical zero rules and source hashes.
The spatial information used here is encoded by component centroids, Gaussian weights and graph-Laplacian eigenvalues. Persistent homology and directional Fourier statistics characterize different observables and do not enter these ratio profiles.
The connection of these finite operators to the curvature construction is explicit. For either weighted graph, the closed form and its quadratic functional are
On the realification of , the Hessian of is the complex-linear representative of ; equivalently use the Hermitian form directly. For Kerr’s declared rate carrier, and . Thus each native readout is a specified function of an exact finite curvature-form representative. The graph energy establishes this mathematical identification; an independently derived material energy or boundary law supplies a physical curvature identification.
10.2 Measured recurrence and its heterogeneity
Table 1 reports the primary hydrogen–image comparisons from the cross-domain study [23]. Five families have strong recurrence across all three widths. The embryo dark view is the recorded exception. Kerr’s 3% Spearman relationship to hydrogen is , and its image relationships are more moderate. The recurrence is broad and domain-dependent.
Table 1. Primary H30 transformed profile versus dark image profiles. Spearman coefficients use all fifteen native incidence slots. Pearson correlation at 3% is secondary. Data from [23].
| Image | ||||
|---|---|---|---|---|
| Embryo | 0.23900 | 0.26856 | 0.04482 | -0.25984 |
| Spiral galaxy | 0.92063 | 0.92328 | 0.96373 | 0.98928 |
| Pollen-like SEM | 0.88641 | 0.88641 | 0.88518 | 0.95464 |
| Leaf | 0.99553 | 0.99463 | 0.99642 | 0.98673 |
| Shroud | 0.94868 | 0.94492 | 0.94765 | 0.97981 |
| Snowflake | 0.98743 | 0.98652 | 0.98921 | 0.99637 |
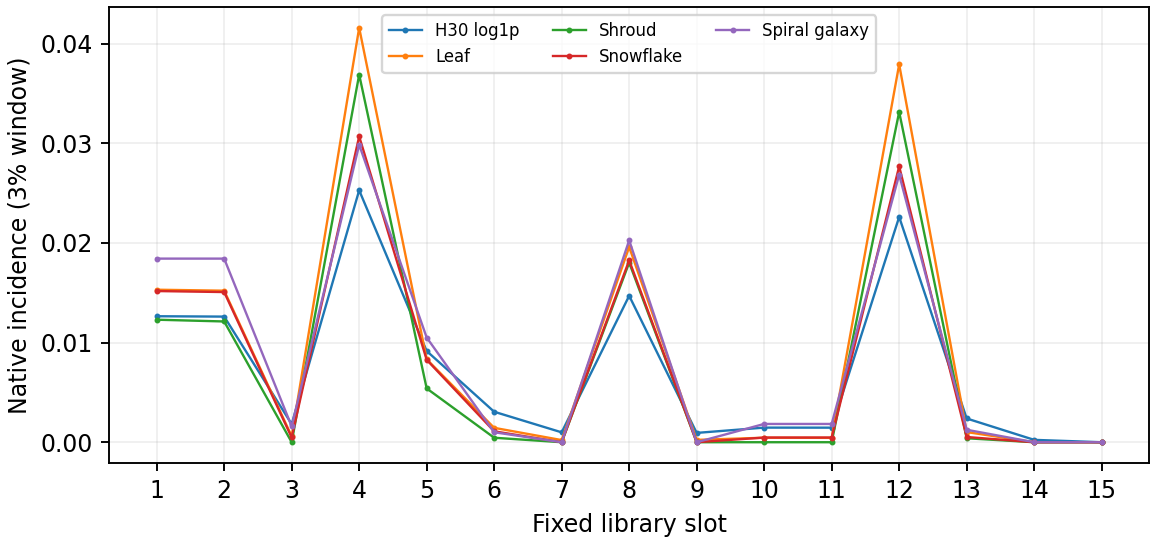
Figure 2. Fifteen-slot incidence profiles at tolerance. H30 uses its native transformed readout; the leaf, Shroud, snowflake and galaxy use their primary dark graphs. These are finite window-incidence profiles. The dark embryo results are reported in Table 1.
10.3 Controls and robustness
Kerr’s development and angular-holdout 3% SUM incidences are and . Table 2 reports three conditional-reference comparisons. U conditions on observed endpoints and degeneracies while drawing transformed uniform groups. P retains labelled coarse raw-log bins and within-block circular phase differences, while shifting common within-bin phases. R preserves fitted overtone trends and within- residual Gram structure while rotating the two-dimensional residual complement. They preserve different, nonnested information. U and P discriminate in both datasets; R is more permissive on holdout.
Table 2. Kerr conditional-reference comparisons [23]. Each row uses 4,999 controls; counts scores at least the observation. The add-one fraction is , a summary under the stated reference law.
| Reference | |||||
|---|---|---|---|---|---|
| U | 4999 | 0 | 0 | 0.06041 | 0.07341 |
| P | 4999 | 10 | 22 | 0.03901 | 0.05304 |
| R | 4999 | 20 | 757 | 0.02518 | 0.00760 |
Hydrogen shell-block permutations retain the allowed support and each block’s full weight multiset while changing placement. The primary hydrogen–Kerr Spearman coefficient has shell mean and sample SD . Hydrogen–Shroud remains close to its observed under the same reference. This establishes conditional profile robustness. Raw 3% UNION abundance is versus shell mean , with no exceedance among 99 endpoints; transformed abundance is versus , with 92 exceedances. The abundance response therefore depends on the readout. The short finite-fiber pilot moved too little to change the statistic and supplies no mixed-reference conclusion.
The original library’s three-domain paired reference fraction is , above the frozen criterion. The Kerr geometry-matched rank fractions were in development and on angular holdout. These library-specificity outcomes remain part of the evidence. They constrain a privilege claim for the chosen centers, while the measured recurrence and conditional-control results remain the phenomena represented by Theorem 9.1.
10.4 Meaning within the common-carrier account
The spectral work establishes a recurring finite structural signature in specified constructions. The present paper establishes where that signature sits: it is a pooled spectral measure of and a phase-difference readout of , both determined by the declared carrier and response. This supplies the proposed connection between visible organization and the coherent face with exact equations and the measured native profiles.
The representation holds for every admitted positive finite readout. It establishes the operator relationship independently of the recurrence’s empirical strength. The measured recurrence and its exact modular representation together support CSCF’s role as an organizing structure for source-to-readout spectral information. Selecting particular cross-domain profiles from physical realization laws is the next predictive development, addressed in Section 14.
Published source: The Canonical Spectral-Curvature Field: A Unified Operator Origin for Coherence, Dissipation, and Spectral Budgets. Read the original PDF alongside the web treatment.