Conditional discrimination and profile robustness
Kerr's successes and the holdout boundary
At the frozen 3% SUM point,
None of the 4,999 U controls reaches either observation. Under P, only 10 in development and 22 in holdout reach it. Both references discriminate the observed incidence strongly. P's distinction is especially informative because it preserves every labeled coarse raw-log bin and within-block circular difference.
Table 3. Kerr conditional comparisons. Each row has . is observed incidence minus reference mean. Add-one fractions are conditional-reference summaries, not probabilities that a physical hypothesis is false.
| Data | Reference | Exceedances | Add-one fraction | Mean incidence | Difference |
|---|---|---|---|---|---|
| Development | U | 0 | 0.0002 | 0.24540 | 0.06041 |
| Holdout | U | 0 | 0.0002 | 0.24468 | 0.07341 |
| Development | P | 10 | 0.0022 | 0.26680 | 0.03901 |
| Holdout | P | 22 | 0.0046 | 0.26506 | 0.05304 |
| Development | R | 20 | 0.0042 | 0.28062 | 0.02518 |
| Holdout | R | 757 | 0.1516 | 0.31049 | 0.00760 |
The R holdout result is consequential: 757 controls reach the observation versus 20 in development. The experiment does not demonstrate strong holdout discrimination beyond the retained overtone trends and Gram structure. The nonnested laws do not identify a unique causal layer or eliminate every noise or artifact explanation across domains.
Hydrogen shape withstands shell-block permutation
Relative shell-permutation displacement of the edge-weight vector is substantial, approximately –. Yet the hydrogen–Kerr Spearman coefficient is 0.521429 at the observation versus a shell mean of 0.521370, SD 0.002551. The difference is just 0.02297 sample SD. The six primary image coefficients are similarly close to their shell means.
Table 4. Primary hydrogen log1p at 3%. Native cross-domain Spearman coefficients and 99 shell-permutation replacements, with the other views held observed. Sample SD describes endpoint variability, not confidence intervals for independent sources.
| Other view | Observed | Shell mean | Sample SD | Standardized difference |
|---|---|---|---|---|
| Kerr | 0.52143 | 0.52137 | 0.00255 | 0.02297 |
| Embryo | 0.23900 | 0.23732 | 0.00506 | 0.33137 |
| Galaxy | 0.92063 | 0.92081 | 0.00040 | -0.45749 |
| Pollen-like | 0.88641 | 0.88634 | 0.00094 | 0.07218 |
| Leaf | 0.99553 | 0.99479 | 0.00196 | 0.37787 |
| Shroud | 0.94868 | 0.94864 | 0.00090 | 0.04428 |
| Snowflake | 0.98743 | 0.98848 | 0.00169 | -0.62409 |
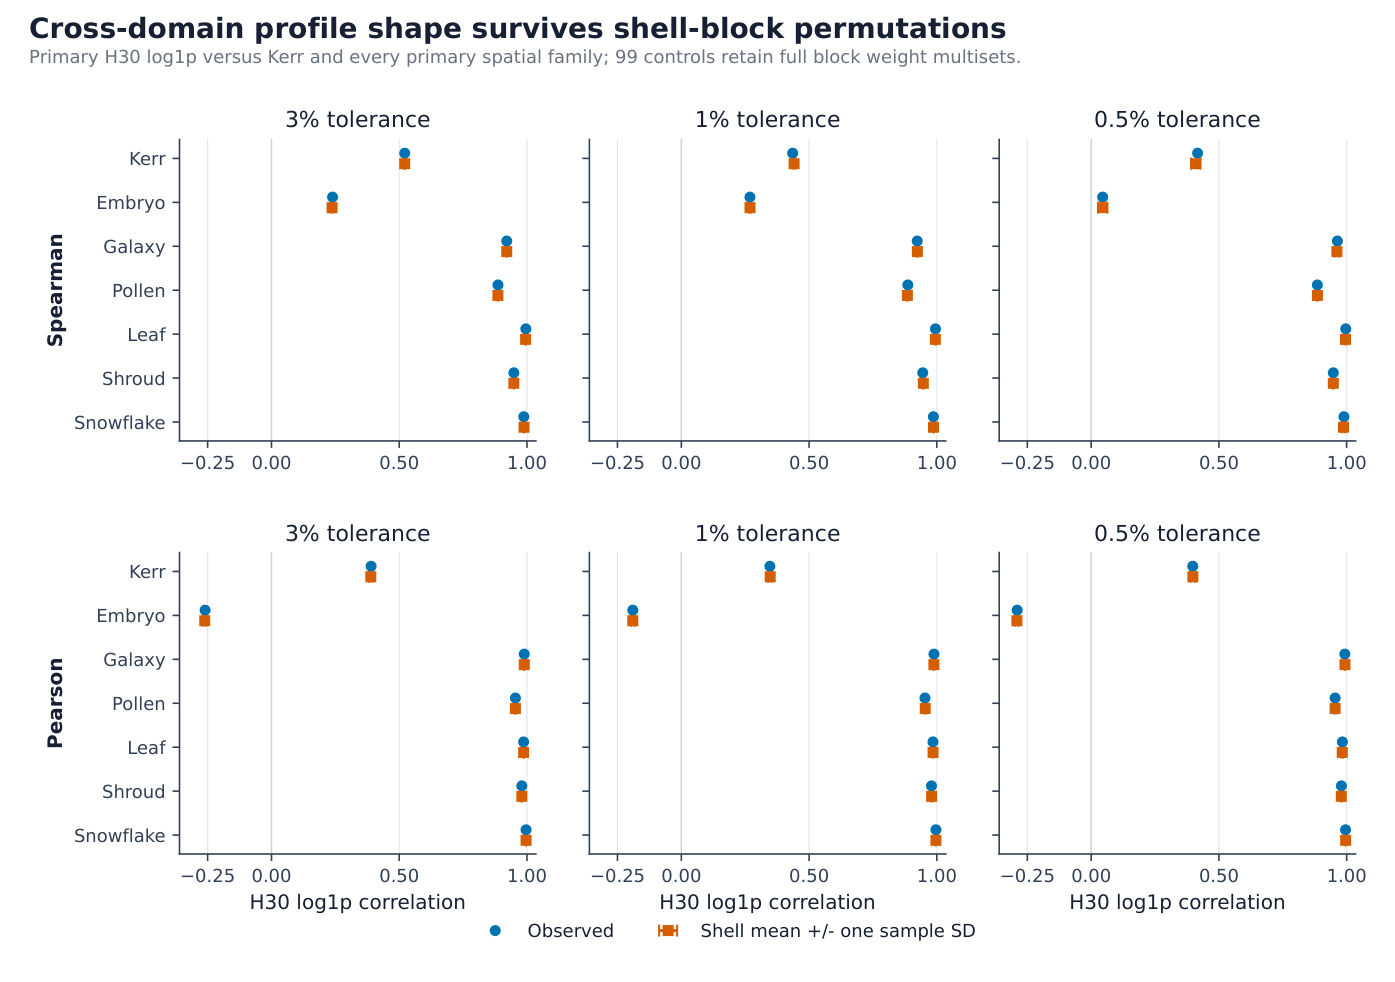
Detailed shell-block structure remains in this perturbation. The result establishes neither random-matrix spectral rigidity nor the removal of all quantum and radial structure. At 3%, the cross-domain differences span to sample SD for Spearman and to for Pearson. The raw/log, width, coefficient and sensitivity comparisons are retained in the supplement; raw results do not follow by inference from the transformed view.
Each replacement changes just one hydrogen view while holding Kerr, the images and the other hydrogen view observed. That is not joint uncertainty across domains. Native correlation is different from correlation of or of standardized null excess. The paired per-library and per-slot Kerr and spatial null moments are absent here. Hydrogen null moments cannot substitute for them, and their absence does not erase the separate Kerr reference results.
Hydrogen abundance changes with the readout
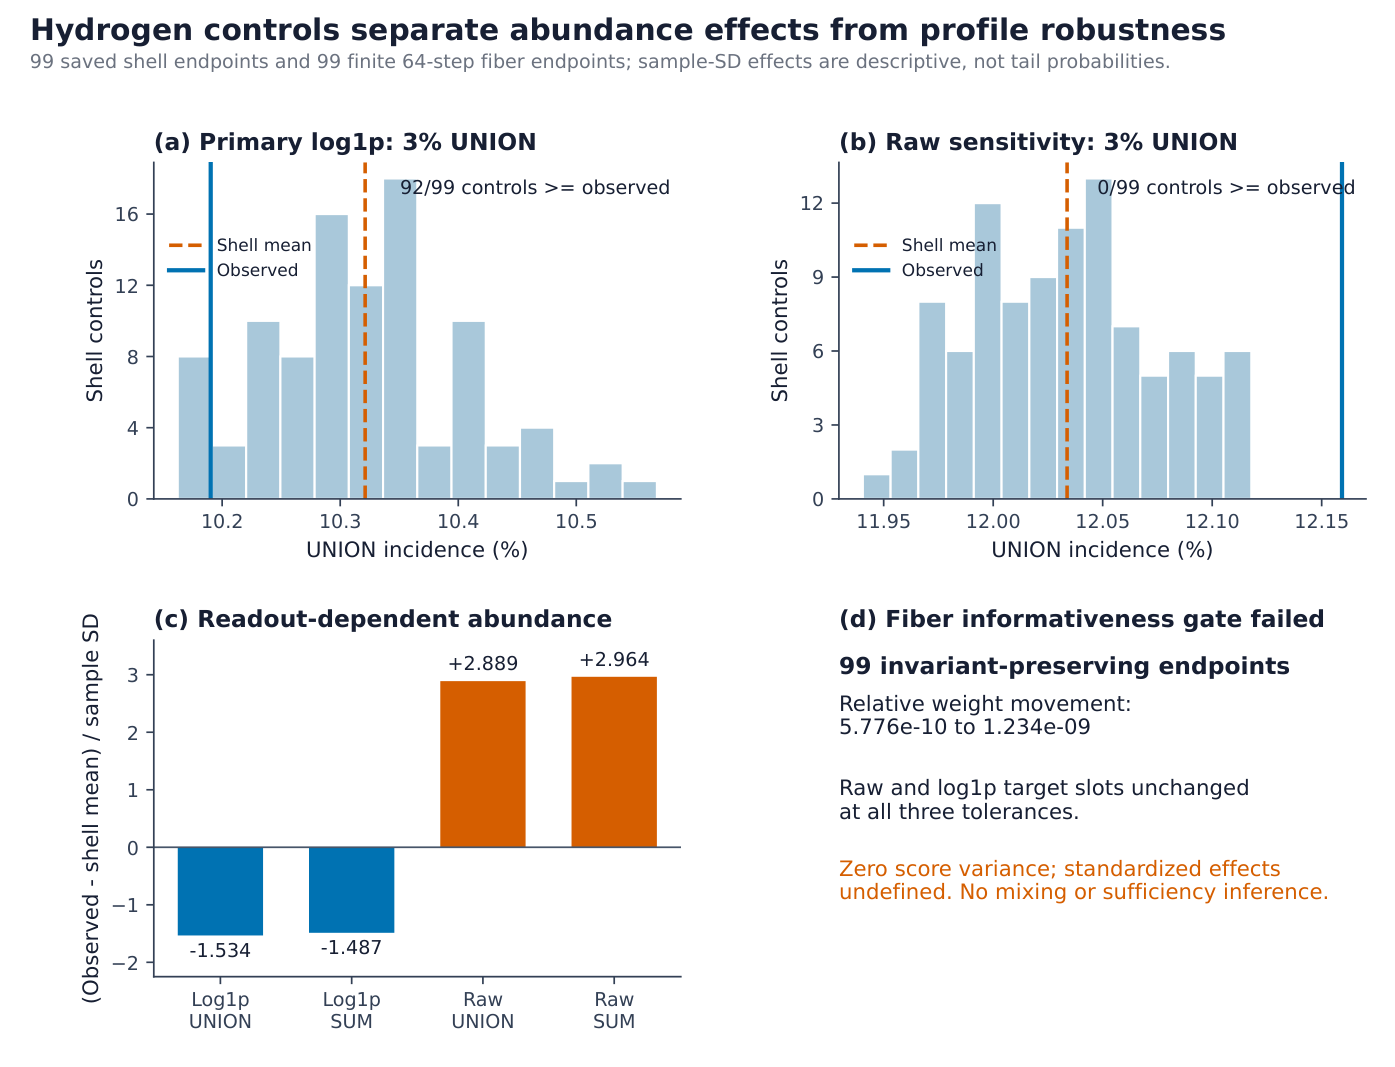
Raw 3% UNION is . Its shell mean is , SD . No retained endpoint reaches the observation, giving descriptive . Primary transformed UNION is , below its shell mean of , SD . Its , and 92 of 99 endpoints reach it. SUM shows the same readout-dependent signs. Raw abundance discrimination and transformed profile robustness answer different questions.
Table 5. Hydrogen shell controls at 3%. Every row uses 214,832 ordered nonself pairs. The standardized differences describe finite pilots, not calibrated extreme tails.
| Readout | Count | Observed | Shell mean | Sample SD | Standardized difference | Reaches observation |
|---|---|---|---|---|---|---|
| log1p | UNION | 0.101903 | 0.103211 | 0.000853 | -1.53358 | 92/99 |
| Raw | UNION | 0.121593 | 0.120337 | 0.000434 | 2.88916 | 0/99 |
| log1p | SUM | 0.109365 | 0.110799 | 0.000965 | -1.48664 | 91/99 |
| Raw | SUM | 0.129650 | 0.128180 | 0.000496 | 2.96446 | 0/99 |
The short fiber endpoints move only to relative to the parent. Although all 99 spectra are distinct at the numerical tolerance, all 90 target slot/readout/width incidences stay fixed. Both aggregate statistics and all 204 target conditional coefficient summaries have zero sample variance. The actual-statistic informativeness gate fails. The standardized effects are undefined. A short restarted run can preserve extra fine structure by locality; this pilot certifies neither mixing nor sufficiency of its named constraints.
Published source: Cross-Domain Spectral Ratio Structure: Refined Recurrence, Robustness and Diagnostic Limits. Read the original PDF alongside the web treatment.